
Seeing the recent bull run, a lot of new investors have entered the stock markets through various routes- direct equity, mutual funds, etc. in search of a quick buck. The majority of these are young, Do-it-yourself (DIY) investors. They just get themselves registered on a fin-tech platform and buy the products within a matter of a few clicks, based on any friend’s advice or by seeing the recent past good performance.
Investing doesn’t work that way. You need to have at least a basic idea about the product you are putting money into. It would be imperative for you to do a fair bit of research to figure out the suitability of the product. Mere seeing past returns is not good enough as the past may not repeat itself in the future.
A comprehensive research approach based on various parameters needs to be adopted while evaluating any product.
When it comes to mutual funds, the mutual fund fact sheet would be the ideal tool to conduct basic research as it provides the information about the fund’s investment strategy, risks involved, past performance, how the money is invested and managed at a single place. This would help you evaluate the fund holistically and decide its suitability. (Also Read: All about the concept and types of mutual funds)
In this post, let us understand what key things to see in an equity mutual fund fact sheet and how to use those in making investment decisions.
Other Related Article Links:
What is a Mutual Fund Fact Sheet?
A mutual fund fact sheet is a concise document containing vital information about how the fund is managed and the overview of fund performance on various risk-return parameters. This is an important document to evaluate and analyse the fund.
Previously, the format of fact sheets was different across various fund houses and it was very difficult to evaluate and compare funds across fund houses. But now, the format of the mutual fund fact sheets is somewhat similar and simple to understand with various graphics and presentations.
It is published by the fund house every month with updated information, available on the AMC website, and research websites like- Value Research, Morningstar, etc.
Key things to look for in an Equity Mutual Fund Fact Sheet:
Generally, an equity mutual fund fact sheet is divided into the following key sections:
Basic Fund Information:
This section of the fact sheet provides you with some general information about the fund like- its investment objective, plans available (direct /regular), options (growth/IDCW), net asset value (NAV) of each plan, minimum investment amount, systematic plans available (SIP, STP, SWP), Assets Under Management (AUM) of the fund. (Also Read: What is SIP in mutual funds?)
It also contains the exit load applicable if you redeem your investment before a certain period of time. This means that you would not receive the entire fund value on redemption. A small percentage would be deducted from the prevailing NAV as a penalty.
You would also find the product labelling and the risk-o-meter of the fund in this section. It would help you gauge the level of risk the fund carries and determine its suitability according to your risk appetite and investment horizon. In 2020, it was revamped with 6 categories of risks- low, moderately low, moderate, moderately high, high, and very high.
Performance Aspects:
This section contains the past performance of the fund. As stated above, past performance is no guarantee of future performance but it gives a fair idea about how the fund has performed over different time periods across market cycles and is likely to perform in the future.
Annualized returns (CAGR) of both lump sum and SIP investment are shown both in percentage terms and growth of Rs. 10,000 across 1,3,5,7 and 10 years (as applicable). Since inception returns are also shown. The fund performance is also compared with fund benchmark and additional benchmark in table format.
However, the better metric to evaluate the fund performance is to check the rolling returns of the fund over different time periods. (Read a detailed post on Rolling Returns here)
Portfolio Details:
This section shows how your money is invested across different sectors and within that across different companies. A fund with a concentrated portfolio across a few sectors/companies can be riskier as compared to a fund with a diversified portfolio across different sectors.
Fund Manager Details:
This section provides you with information about the qualifications of the fund manager(s), work experience, and other funds he/she has managed in the past or is currently managing. This helps you know about the expertise and the track record of the person responsible for managing your money.
Key Ratios in an Equity Mutual Fund Fact Sheet:
- Portfolio Turnover Ratio: This ratio tells us the churning or the trading activity happened in the portfolio in a given year. It is computed by taking the lower of the total of new purchases or sales over 12 months, divided by the fund’s average assets under management (AUM). A higher portfolio turnover ratio indicates frequent churning in the portfolio and a lower portfolio turnover ratio indicates a buy and hold strategy. Generally, index funds have a very low portfolio Turnover Ratio. (Read a detailed post on portfolio turnover ratio here)
- Standard Deviation: It is the measure of a fund’s volatility. It signifies how much the fund has deviated from the historical average returns. A higher standard deviation indicates higher volatility in fund returns and thereby higher risk.
- Beta: Beta of a fund signifies the volatility of the fund with respect to the benchmark. The beta of the benchmark is represented by 1. Beta greater than 1 indicates that the fund is more volatile than the benchmark and vice versa. The beta of Index funds is 1. (Also Read: How mutual fund benchmarks would help you select the right fund?)
- Sharpe Ratio: It is the excess return generated over and above the risk-free return in exchange of the risk taken by it, represented by the standard deviation. Higher the sharpe ratio better is the risk-adjusted performance of the fund.
- Expense Ratio: It is the cost of managing the fund, borne by you. It is charged from the fund returns. The expense ratio of the direct plan of the fund is lower than the regular plan. Index funds have lower expense than the actively managed funds. The fund with a high expense ratio should justify it by delivering superior performance. (Read a detailed post on expense ratio in mutual funds)
In the Index fund fact sheet, the other important metric to look for is the tracking error of the fund. This indicates the difference between the returns generated by the fund and the underlying benchmark. Here, you need to understand that the investment objective of the index fund is to generate returns similar to the benchmark and not to beat it. (Also Read: How attractive is passive investing in India?)
Equity Mutual Fund Fact Sheet: Interpretation
Let us take the example of ICICI prudential Multi cap mutual fund fact sheet and try to interpret some of the key information.
1. Product Labelling and Risk-o-meter:
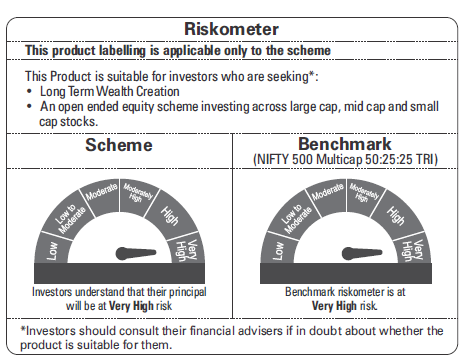
This indicates that the fund is in a very high-risk zone and may be subject to short-term volatility and invests across large, mid, and small-cap stocks- increasing the risk levels. So, to even out the volatility you should invest in the fund for the long-term horizon, i.e., 5-years and above, and is not suitable for a short-term horizon.
2. Exit Load:
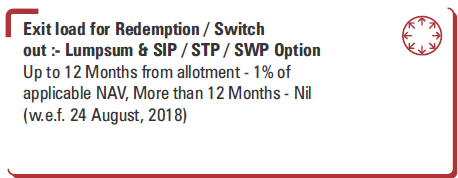
This shows that both lump sum and systematic investments like- SIP, STP, and SWP options are available and a 1% penalty would be charged on the NAV if you redeem your investment before 12 months. After 12 months, no exit load would be applicable.
3. Performance Tables:
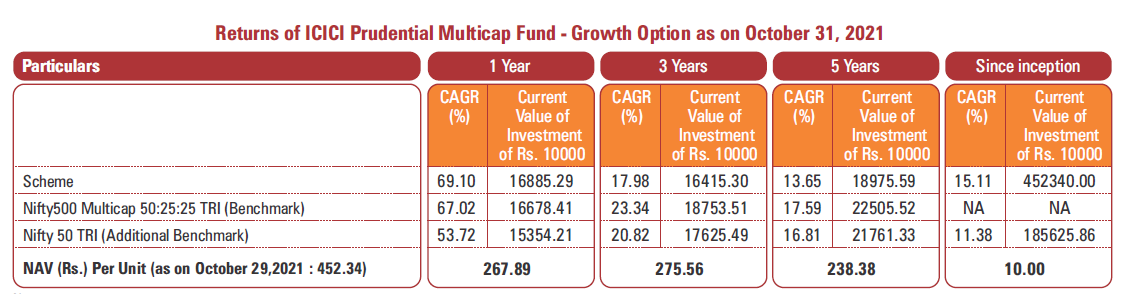
This shows that the fund has underperformed the fund benchmark over a 5-year horizon. It could be because of a recent SEBI regulation of changing the investment strategy of multi-cap funds. (Also Read: 5 recent mutual fund changes you should know)
4. Company and Sector Allocation:
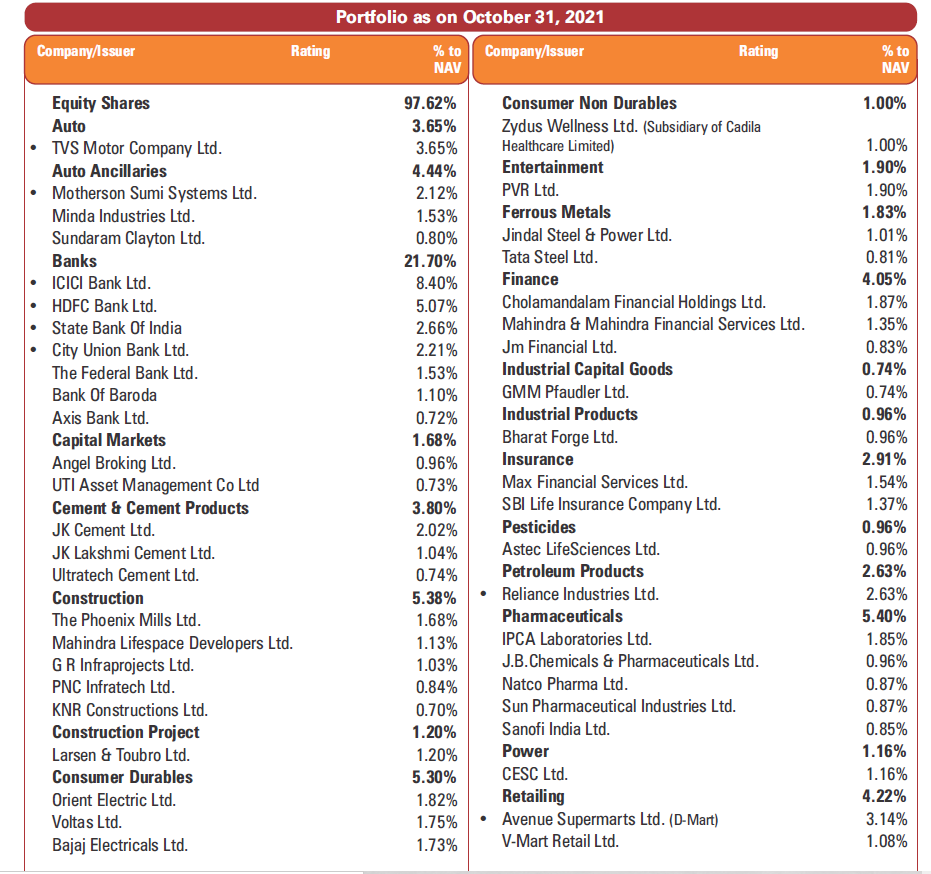
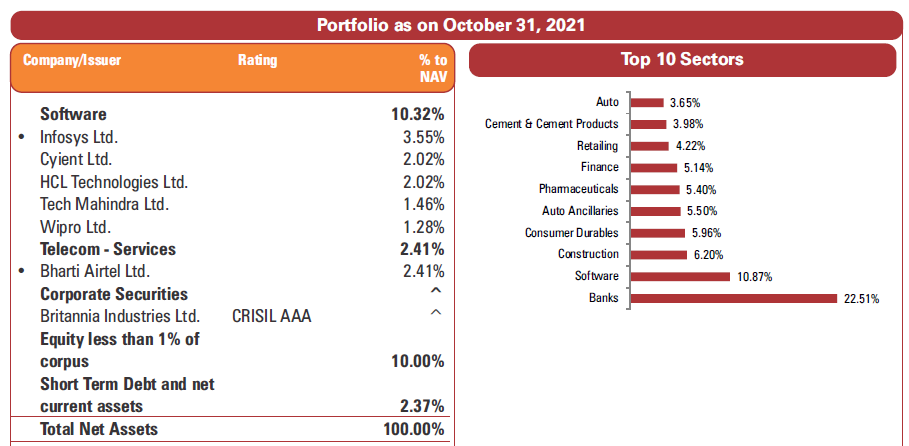
It shows that 97.62% of the fund assets are invested into equity shares and the rest 2.37% share is comprised of short-term bonds and cash.
Also, the fund is well-diversified across companies and sectors with maximum exposure of 22.5% to banks. It means that the fund manager is highly optimistic towards the Banking sector.
5. Fund Manager Details:
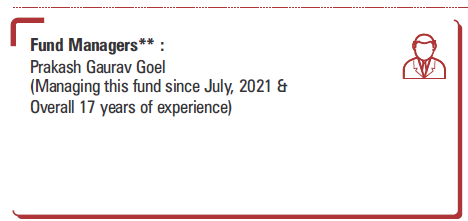
This shows the fund manager has rich experience in the fund management space.
6. Ratios:
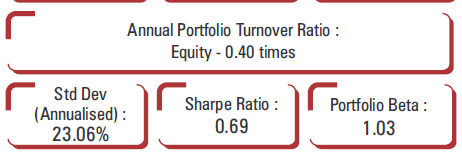
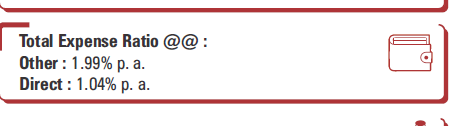
It shows that the standard deviation and Beta are high but the Sharpe ratio is low. So, it can be said that the fund performance is not that great. Again, one of the reasons could be the recent SEBI prescribed changes on multi-cap funds. Although, the portfolio turnover is low, indicating the conviction of the fund manager on the stock pickings. The Expense Ratio is also high.
However, better insights into the ratios can be gauged by comparing this fund with another fund of the same category. (Also Read: Ways to compare mutual funds)
Conclusion:
A Mutual Fund fact sheet is a good tool to analyse various aspects of the fund and compare the funds within the category. It gives a fair idea about the fund and its investment management. So, it is recommended for the investors to glance through the key information of the fund before making any investment decision and after investing too.
This Article is written by Mr. Varun Baid, CFP Professional


 Manikaran Singal is the founder and Chief financial planner at Good Moneying Financial Solutions. He is a CERTIFIED FINANCIAL PLANNER CM and SEBI registered Investment adviser (Regd no. INA 100001620). He’s having 20+ years of experience in financial services space.
")


Comment:
Excellent treatment of the subject; good links for details.
Quary:
ValueResearchOnline does not provide comparisons based on fund type per see, at least in most cases. For example, if we check on a Index funds, in the comparison table it provides – not all index funds in that catogory- but funds with similar portfolios only. Is this a valid comparison?
Actually Not Seetharama…that is why it is important to have strong hold on the subject yourself…rather than depending on these research websites.
Focusing on ratios is much more important than focusing on returns. Focusing on Beta allows one to pick a less volatile fund and a higher Sharpe ratio can mean that the fund has actually received a higher return for taking on the risk. These are important.